Who Gets In?

What has changed — and what hasn’t —in Carolina admissions data over the last two decades? Think you know how hard it is to get into Carolina? The numbers show just how difficult it has become.
In September last year, UNC’s admissions office released preliminary data on the first-year class that had landed on campus just a little more than a month before. The data was highly anticipated because it showed the racial makeup of the first class to enter Carolina since the Supreme Court had ruled UNC’s consideration of race in admissions was unconstitutional.
The admissions office reported the representation of three of the five minority groups it tracks had dropped — Black, Hispanic, and American Indian and Alaska Native. The share of Black students in the incoming class dropped to the lowest level in more than two decades, according to data supplied to the Review. Officials in the admissions office said it was unclear how much the ruling affected the racial makeup because a federal computer program students use to apply for federal financial aid was unable to take applications, delaying the ability of colleges to issue student loan packages. The delay may have resulted in many students forgoing their first college choice and accepting offers from less expensive universities.
The racial shifts are just one of many changes students in the latest incoming undergraduate class faced, with some changes continuing long-term trends and some that show historic transformations. The numbers show today’s applicants face a far different admissions landscape than alumni did decades ago. That may be obvious, but when the data is examined, the differences come in stark contrast. What’s abundantly clear — and measureable — is applicants face less chance of being admitted today, even for in-state applicants and even for students who have legacy ties, if that plays a factor at all. The sheer number of applications have more than doubled in 10 years, with a record increase in the number of applications for the incoming class this fall. Most living alumni attended Carolina when more female than male undergraduates walked the campus. That hasn’t changed much. But why?
The data tell a story about Carolina that many alumni may understand in general terms. But when the numbers Carolina Alumni has been collecting for the past 22 years are spread out to see, the metamorphosis of incoming classes becomes more fully comprehended.
The Review collated data on the incoming classes from 2003 to 2024 and submitted it to University Media Relations with questions. Read on for the University’s explanations for the changes and for the trends that have remained constant.
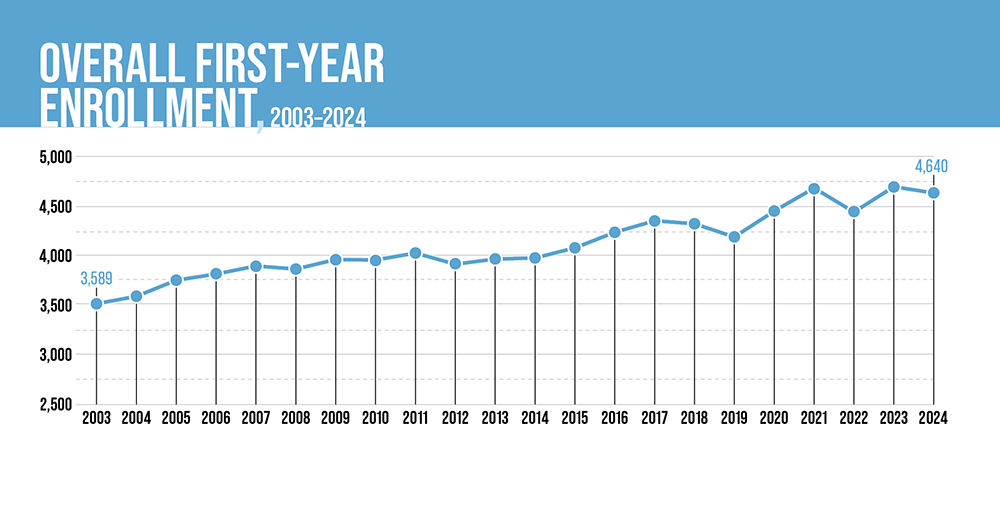
OVERALL FIRST-YEAR ENROLLMENT, 2003–2024
Undergraduate class sizes have steadily increased for decades. Expect enrollment to jump as Carolina adopts a policy to admit more students — 500 more in the 2025 entering class.

APPLICATIONS BY YEAR, 2003–2024: N.C. RESIDENT, NON-N.C. RESIDENT, and TOTAL
Over the past two decades, Carolina has seen a steady increase in the number of high school students who want to attend the University. But in the past three years, the number of applications to Carolina has spiked, increasing on average by more than 11 percent, twice the average rate from 2003 to 2020. And this year the number of applications has increased 15 percent. What gives? Today’s high school students are less bound to applying to just regional universities than they were two decades ago, according to University Media Relations. And in 2021, when the COVID pandemic was raging, the UNC System Board of Governors made taking the SAT and ACT optional, causing a sharp increase in applications as more students chose to apply to highly selective schools such as UNC, which ranked fifth this year among all public universities by U.S. News and World Report, the University noted. Data from college counselors indicated that students began increasing the number of schools they applied to. The board changed its policy for the incoming 2025 fall class, requiring test scores for students with a weighted GPA between 2.5 and less than 2.8. The only time UNC applications decreased in the past 21 years was for the entering class in the fall of 2020, when universities nationwide experienced a drop.

ACCEPTANCE RATE, 2003–2024: N.C. RESIDENT, NON-N.C. RESIDENT, and TOTAL
It makes sense that as more students have been accepted, class sizes have increased. But what may be counterintuitive is that UNC’s acceptance rate has dropped, most likely due to ever-increasing applications. The class entering in fall 2024 had faced the most competitive admissions cycle, with only 15 percent being admitted, down from 36 percent for the 2003 entering class. With that has come a dropping yield rate — the percentage of students who accept UNC’s offer to attend the school — from 54.6 percent in 2003 to 45.4 percent in 2024. “With the rise in applications at Carolina, we have become increasingly selective,” University Media Relations said. “The higher our selectivity, the more choices admitted students have at other highly selective universities, which applies universally. Typically, heightened selectivity can result in a decreased yield rate, as the top students we admit are likely to attract offers from other competitive institutions.”
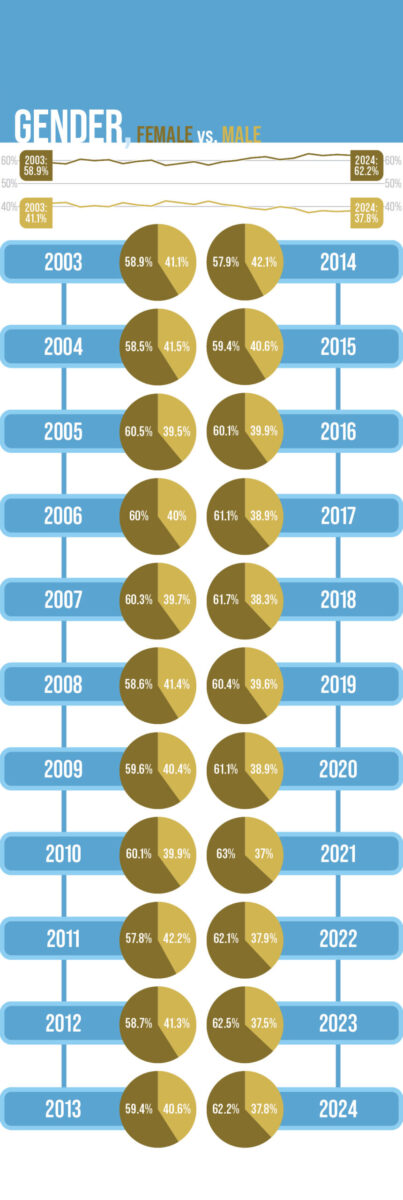
GENDER, FEMALE vs. MALE
Women have outnumbered men on college campuses for decades, and UNC is no exception. During the COVID pandemic, when college applications nationwide dropped because of economic uncertainty and other issues, male students made up the majority of those choosing not to apply. As a result, the 2021 incoming class, at the height of the pandemic, had the highest percentage of women in the past 22 years — 63 percent compared with a nationwide average of 59.5 percent. “Each year, a notably larger share of women compared to men apply to college,” the University said. “This corresponds with a national trend seen over the years.” One explanation may be that men have more good-paying job opportunities that do not require college credentials than women have, according to New America, a think tank in Washington, D.C. In 2023, the overall wage gap between men and women widened, reversing a five-year trend of it narrowing. Will the trend of majority-female classes continue? Most likely, because, the University points out, “gender cannot be considered in the admissions process.”

LEGACY ACCEPTANCE RATE, 2003–2024
N.C. RESIDENT ALUMNI CHILDREN, NON-N.C. RESIDENT ALUMNI CHILDREN, and NON-ALUMNI CHILDREN
The acceptance rate for students from alumni families also has been affected by an increasing number of applications. During the past 20-plus years, the acceptance rate for North Carolina students from alumni families has been cut by a third, and for legacy out-of-state students, the rate has been cut nearly in half, which means it’s getting close to the acceptance rate for non-legacy applicants (13.9 percent for the 2024 incoming class, the lowest in at least two decades, and likely longer). But why the higher acceptance rate for legacy candidates? “It’s hard to generalize over a 20-year span, but alumni applicants tend to be strong students as they come from families that are Carolina-educated and emphasize the importance of a college degree,” the University said in an email. As Steve Farmer, former vice provost for enrollment and undergraduate admissions at UNC, told the Review in 2012, a legacy boost rarely happens because students of alumni “come from families … where education matters, where they’ve done well in school, taken harder courses, and done all the things we ask all candidates to do, and it just falls out in the end that resident legacy kids are admitted at a higher rate.” (See “Family Matters,” March/April 2012.)
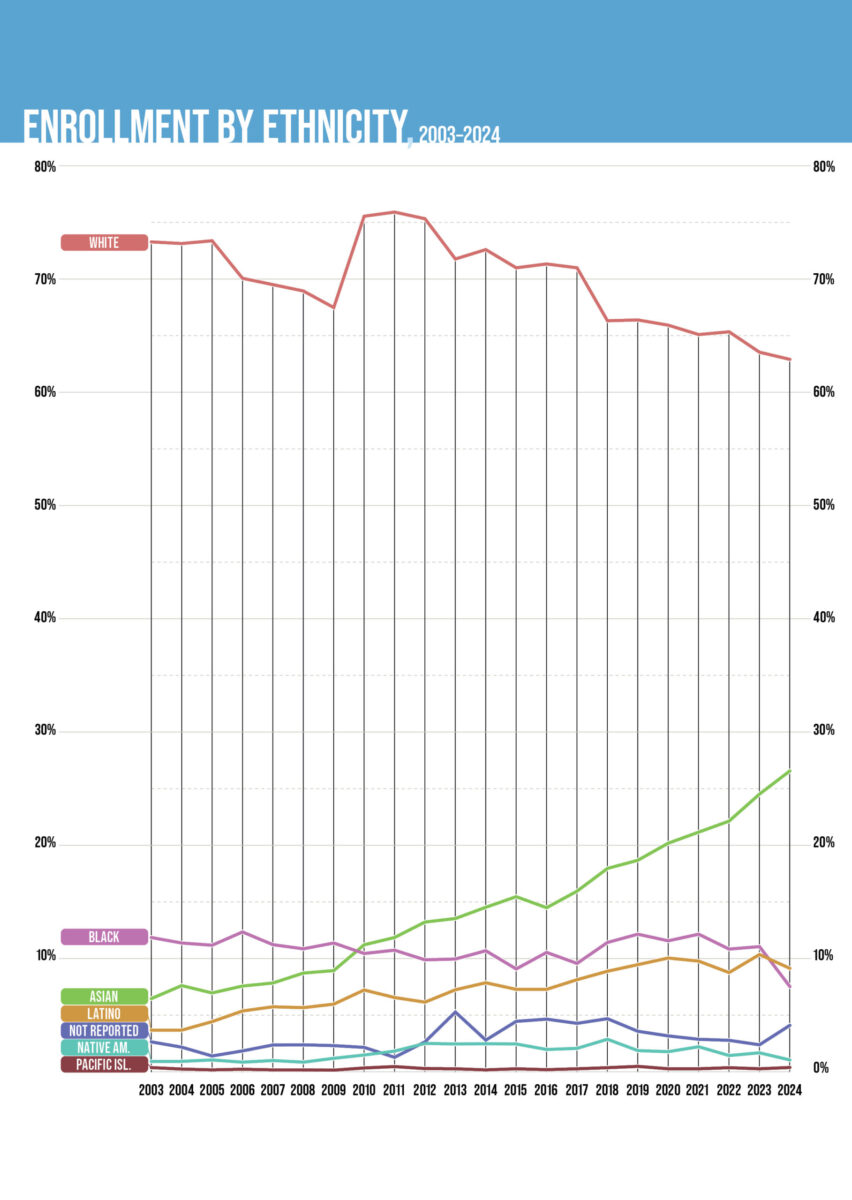
ENROLLMENT BY ETHNICITY, 2003–2024
The 2024 entering class was the first to have their applications considered under a new application process that did not take race into account, a result of the 2023 Supreme Court ruling that found the practice unconstitutional. The racial makeup of the most recent incoming class showed the proportion of Black students dropped to 7.5 percent, the lowest in more than 20 years, and the ratio of Hispanic students fell to 9.1 percent, which was still higher than before 2019. Native American and Alaska Native students dropped to 1 percent, the lowest since 2008. The share of Asian students continued their decade-long increase, hitting a high of 26.5 percent in the 2024 incoming class. While experts attribute some of the decline to the Supreme Court ruling, many say the decline also could have been partly caused by the computer problems that occurred last spring with the U.S. Education Department’s Free Application for Federal Student Aid (FAFSA). The glitches caused delays in colleges issuing financial aid packages, which may have resulted in many students forgoing their first college choice and accepting offers from more affordable universities. University Media Relations said “it’s simply too early to know” how the Supreme Court decision has affected the racial makeup of future incoming classes.
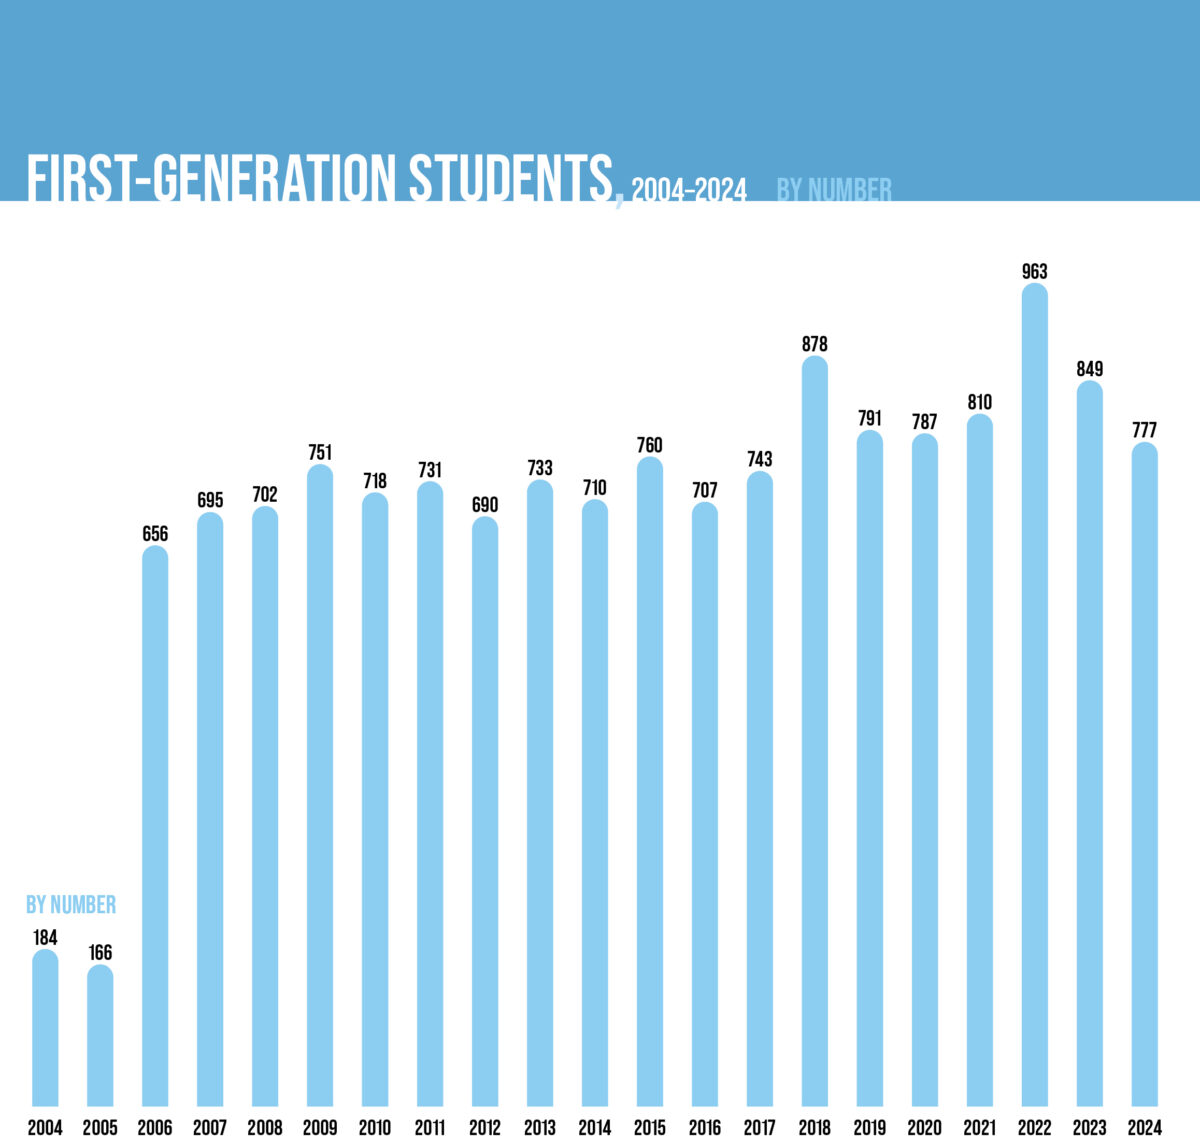
FIRST-GENERATION STUDENTS, 2004–2024 BY NUMBER and PERCENTAGE OF ENTERING CLASS
Their percentage in Carolina’s freshman class nearly quadrupled in 2006. Since then, first-generation students have steadily represented about a sixth of each class. The increase may be attributed to the Higher Education Reconciliation Act of 2005, which increased funding for Pell Grants and expanded loan programs, enhancing college affordability for low-income and first-generation students nationwide. In 2007, the College Cost Reduction and Access Act reduced interest rates on student loans and increased grant aid.
University Media Relations also attributed the rising number of first-generation students to Carolina Covenant, the need-based scholarship program founded in 2004 that has made college possible for more than 11,000 low-income students. About half of Covenant Scholars are first-generation students. More recently, first-generation students from rural North Carolina have found support through the Kessler Scholars Program, founded in 2023, and the Tar Heel Guarantee, which, since 2024, has allowed Carolina to cover out-of-pocket costs for tuition and fees for resident undergraduates whose families make less than $80,000 a year.
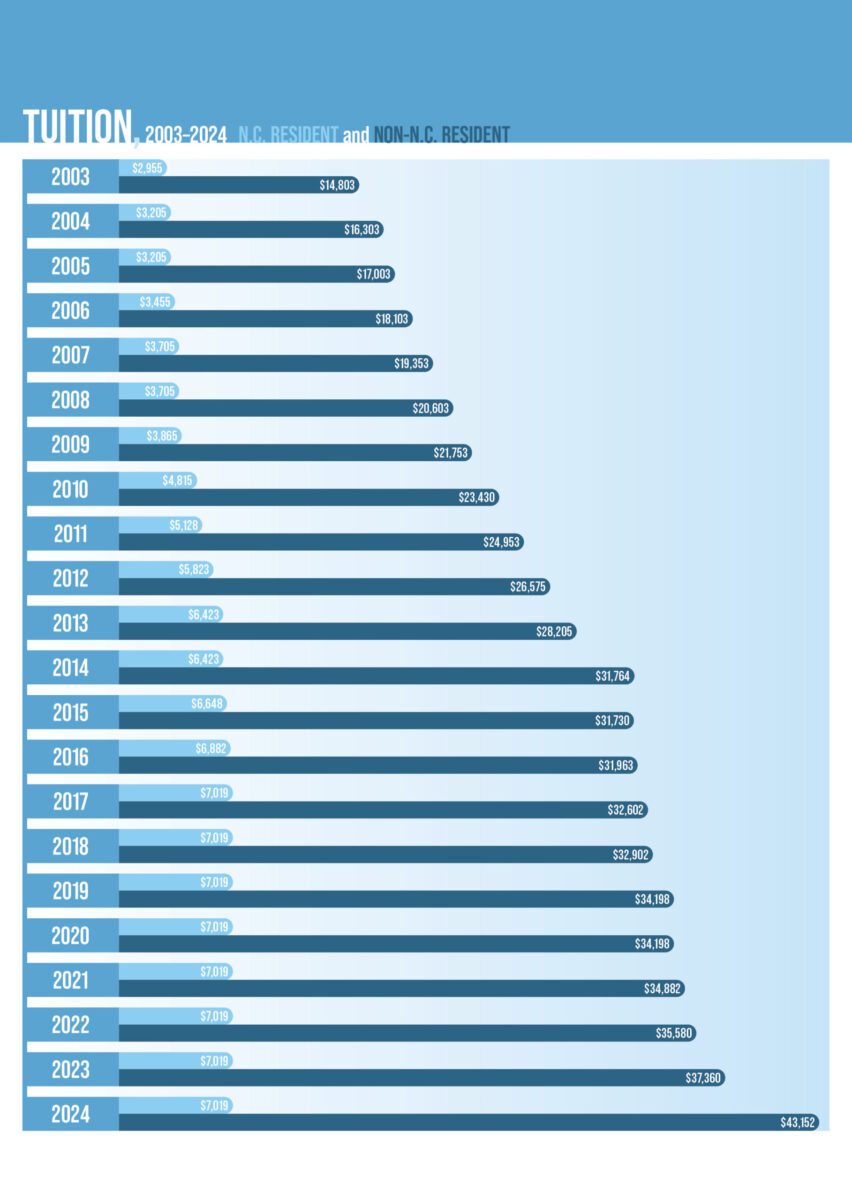
TUITION, 2003–2024
N.C. RESIDENT and NON-N.C. RESIDENT
It’s been a source of pride among UNC administrators and trustees that in-state tuition for undergraduates has remained unchanged since 2017. The only time tuition went that long without changing was from 1961 to 1970, when it stayed flat at $175 a year. Nonresident tuition, however, is a different story. It has steadily increased over the first quarter of the century, and last fall, out-of-state first-years were met with the largest nonresident tuition increase since 1990 — 13.4 percent to $43,152. Carolina’s out-of-state tuition is in the middle of the 10 public institutions the University compares itself to. (Five of UNC’s peer schools have higher nonresident undergraduate tuition.) UNC Media Relations said this year’s out-of-state increase “will support various campus initiatives, including enhancements to facilities, academic programs and student services. By raising out-of-state tuition, UNC can help the University meet its commitment to access and affordability for North Carolina families.”
IN-STATE: 137.53% increase from 2003 to 2024
OUT-OF-STATE: 191.5% increase from 2003 to 2024
Thanks for reading the Carolina Alumni Review
Carolina Alumni members, sign in to continue reading.
Not yet a member? Become one today.